ROI Calculator: Packaging Line Layout Changes in Toronto (Labor, OEE, Energy)
Stop Guessing Line ROI and Start Measuring It
Packaging in Toronto is not getting any easier. Labour is tight, space is expensive, and energy costs keep plant managers awake at night. At the same time, sales teams want more SKUs and higher volumes, often without much extra floor space to work with.
That is why every change to your packaging line plant layout and design in Toronto needs a clear business case. When you treat your layout through an ROI lens, you can move from gut feel to hard numbers. In this article, we will walk through a simple way to measure the impact of layout changes using four levers, labour, OEE, footprint, and energy, and then show you a before and after case study framework you can reuse inside your own facility.
Key ROI Levers in Modern Packaging Line Layouts
When we look at packaging line layout, we always come back to the same four questions: How many people do you need, how well does the line run, how much space does it take, and how much energy does it draw?
For labour efficiency, smart layout changes often create big gains without big drama. Some examples include:
- Shorter walk paths between key stations
- Better placement of controls and HMI screens
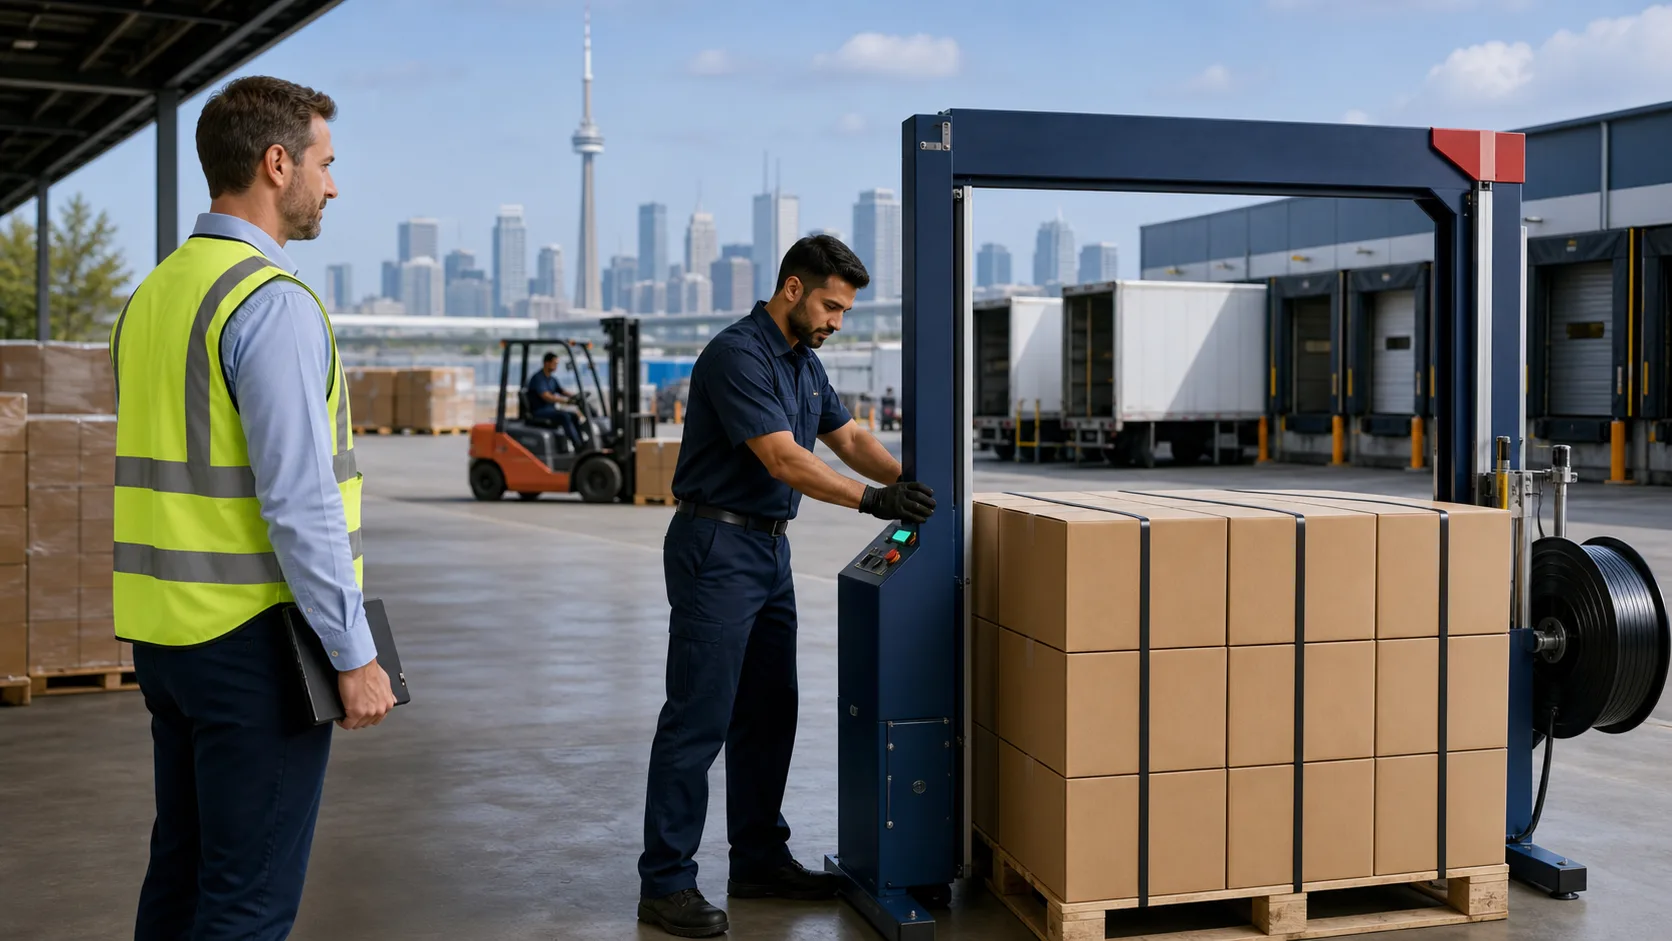
- Automated case packing, taping, and palletizing
- Clear line of sight for one operator to manage more than one machine
All of these cut down on non-value-added time, such as walking, bending, lifting, and waiting. When operators do fewer manual touches per case, you start to see lower overtime, fewer temporary staff, and better use of skilled trades on higher value work.
OEE and throughput are just as important. Layout ties directly into:
- Availability, fewer changeover delays, easier access for cleaning and maintenance
- Performance, higher sustained line speed, less stop and start due to bottlenecks
- Quality, more stable product flow, fewer drops and jams, less rework
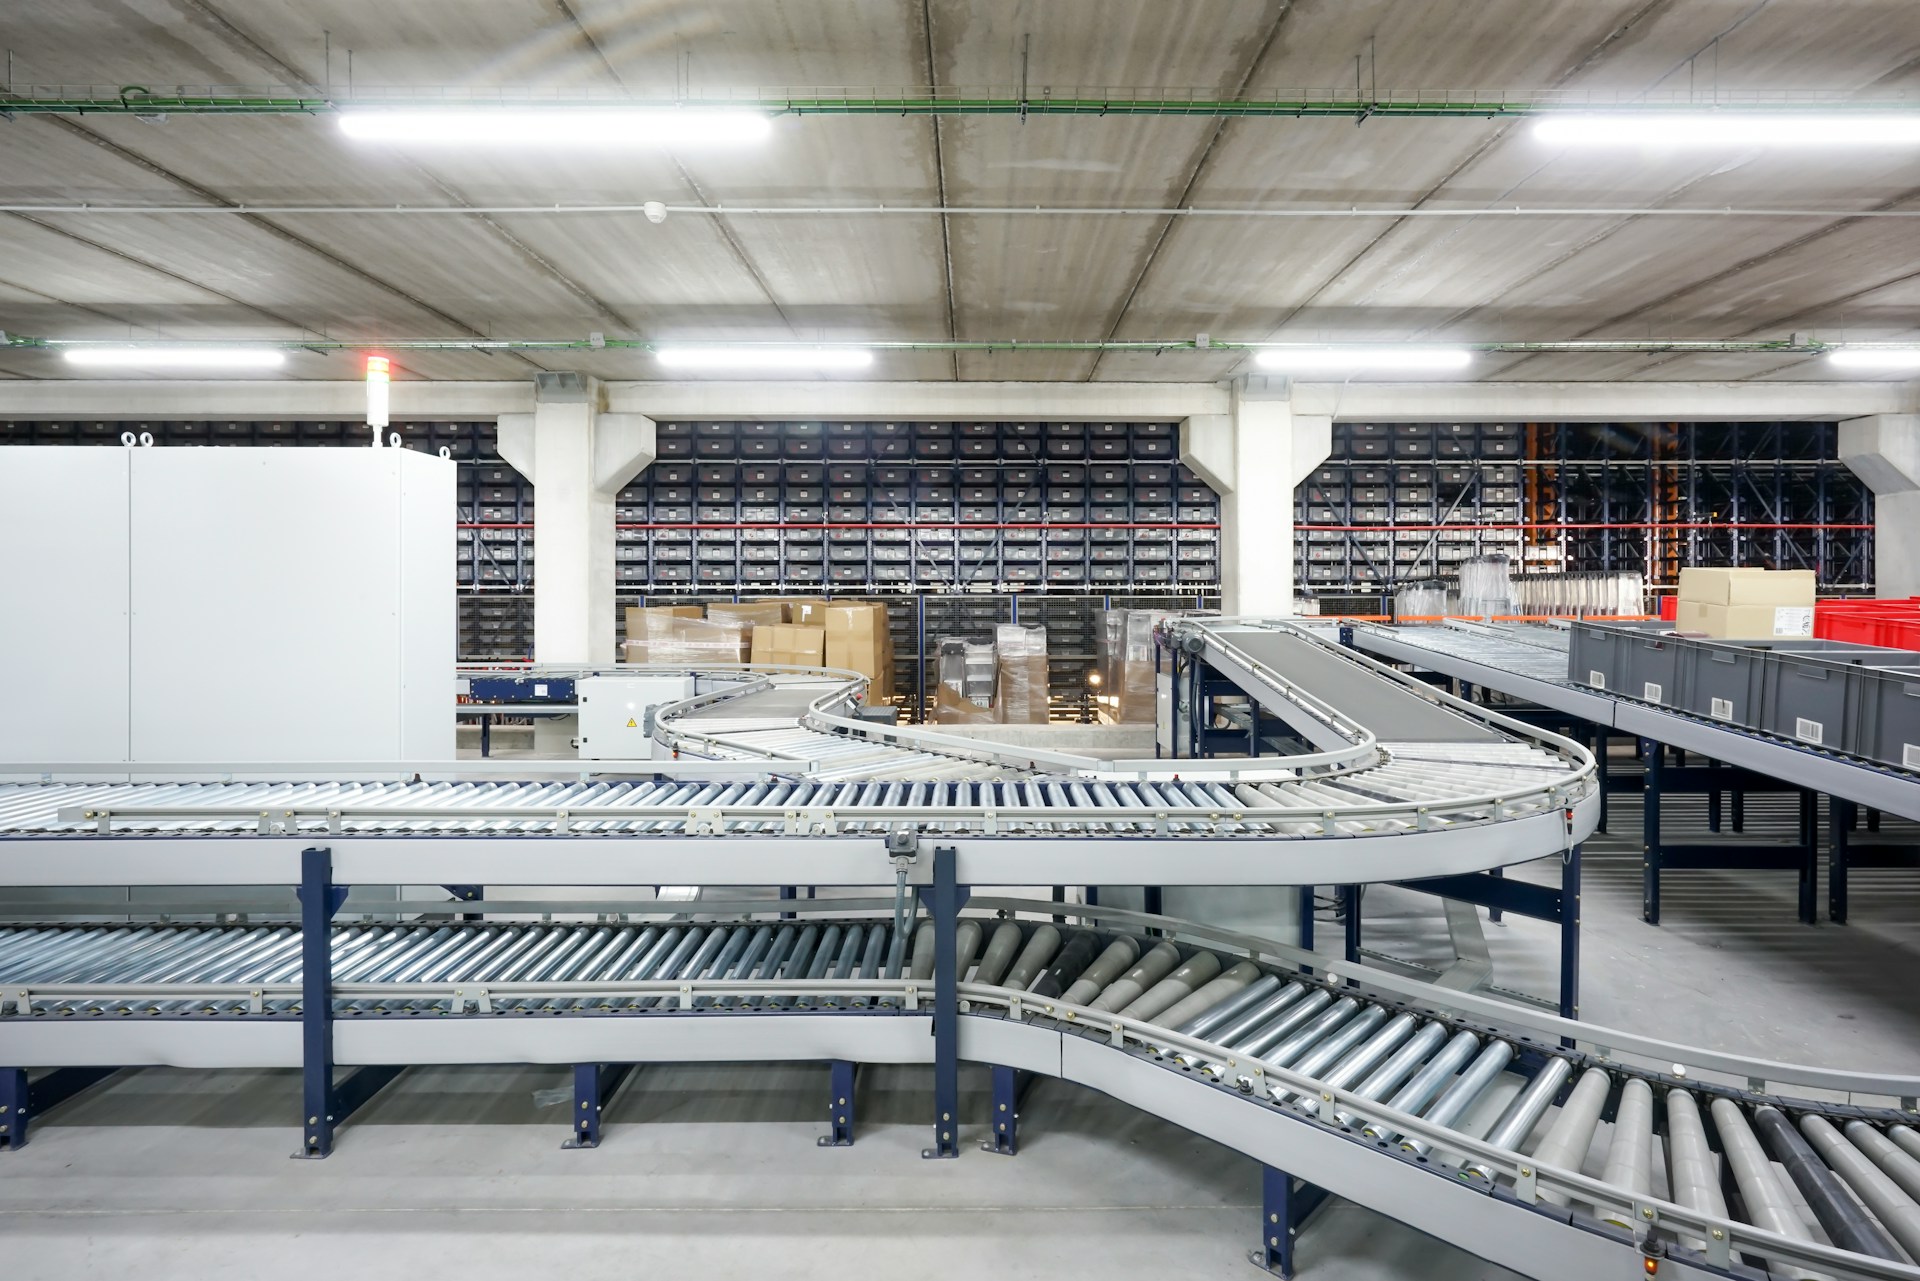
For example, a poorly placed accumulation table or a tight corner in the conveyor can cause small, repeated stops. Over a full shift, this can quietly drain a lot of throughput. Cleaning up the layout can tighten your OEE without even changing the main packaging equipment.
Footprint and energy are often the silent costs. In the Greater Toronto Area, industrial floor space is not cheap, and zoning for expansion is not always simple. A compact, well-thought-out layout can:
- Free up room for future lines or new products
- Reduce congestion around palletizing and shipping
- Lower forklift traffic and related risks
Energy use connects to layout too. Shorter conveyor runs, efficient drives, proper controls, and reduced idle time can lower kilowatt-hours and peak demand. Over time, that can help soften the impact of local hydro rates on your operating budget.
Your Practical ROI Calculator for Layout Changes
To bring this together, we like to strip the math down to a few clear formulas. Start by defining core metrics for each lever.
For labour, focus on hours saved per shift:
- Labour savings per year = hours saved per shift × shifts per year × fully loaded hourly rate
For OEE and throughput, think in terms of saleable units:
- Throughput benefit per year = additional saleable units × average margin per unit
For footprint, look at how much space you can avoid using:
- Footprint benefit per year = square footage freed up × lease rate or internal space value
For energy, track kWh:
- Energy savings per year = kWh saved × blended hydro rate
Once you have yearly savings for each category, you can total them to get net annual benefit. From there, a simple ROI view is:
- Simple ROI = net annual benefit ÷ project cost
- Payback period = project cost ÷ net annual benefit
Choosing a time horizon is key. Many plants look at three to five years, long enough to show the full impact of seasonal peaks and any ramp-up curve.
Toronto-specific inputs matter. Local plants often have:
- Higher manufacturing labour rates than other regions
- Industrial leases that put real pressure on every square foot
- Hydro rates that make peak demand and idle running a real concern
It is also smart to factor in seasonal production. For example, a line that runs hardest in late summer and early fall for back-to-school or holiday build might justify more automation, because the cost of missed shipments or added shifts in those windows is high.
Before and After Case Study Framework for Toronto Plants
To make the ROI calculator real, you need a clear view of before and after conditions. Start by documenting the current state. A simple checklist could include:
- Number of operators per shift on the line
- Average line speed in units or cases per hour
- Average changeover time for key SKUs
- Typical unplanned downtime per week
- Current floor space used by the line
- Average energy use per shift or per case
For the after state, you then map what changes when the packaging line plant layout and design in Toronto is updated. This might include:
- New end-of-line automation like case sealers or palletizers
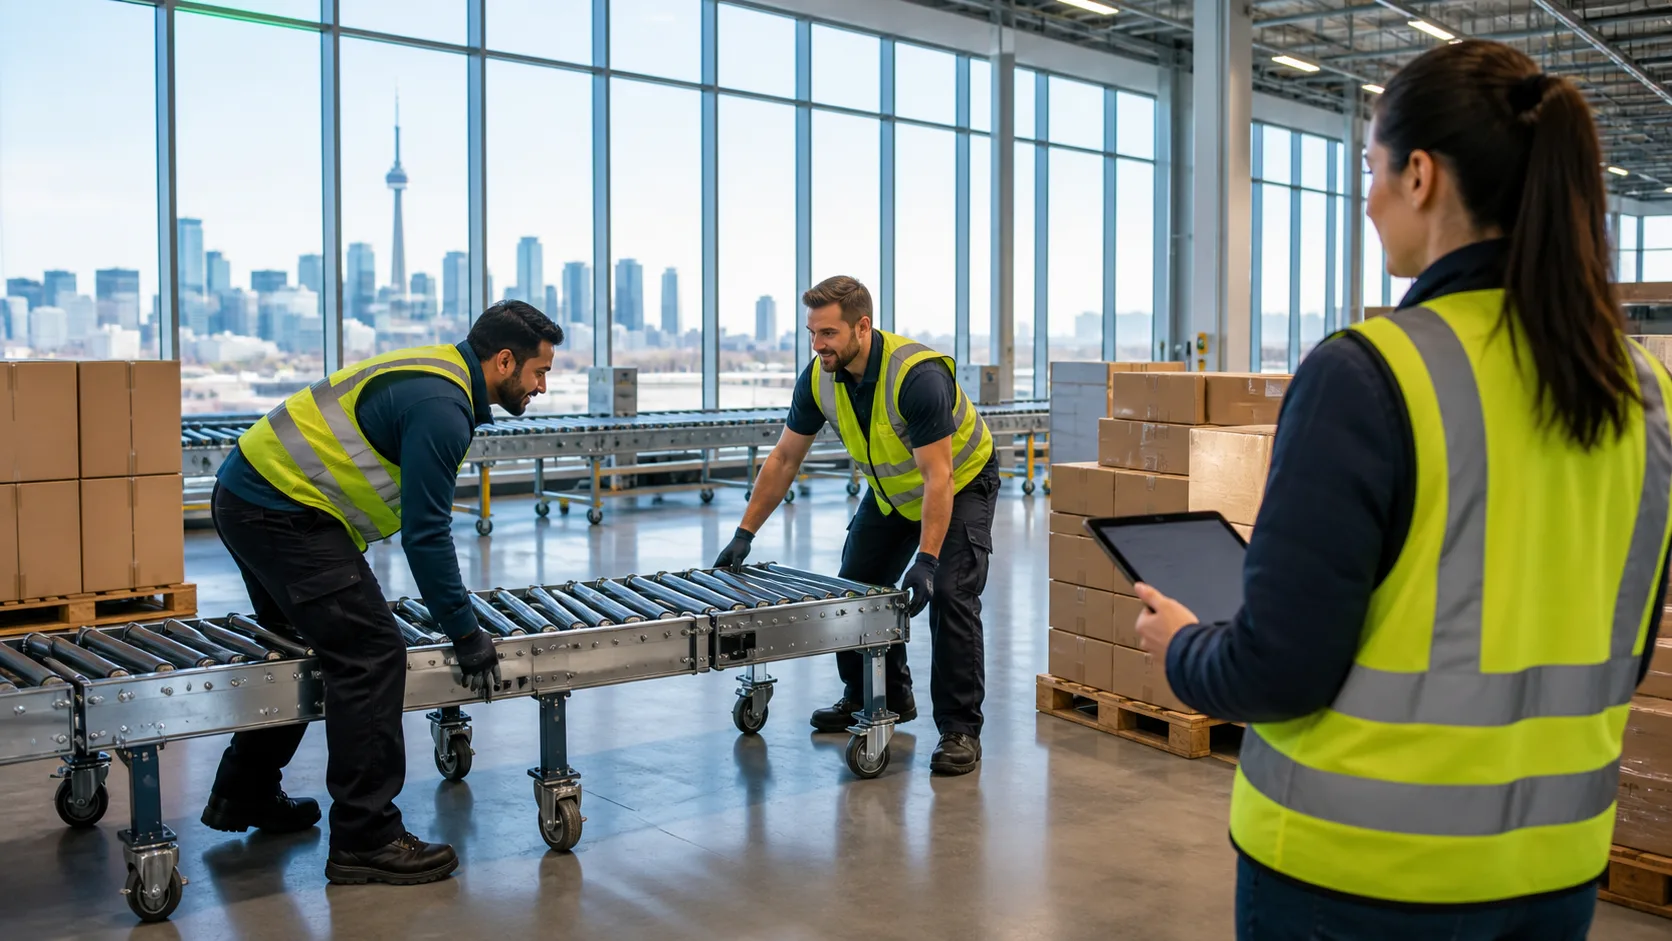
- Revised conveyor routing and accumulation
- Guarding and safety improvements for better operator access
- Updated staffing plan by station and by shift
For each item, estimate new values for labour, OEE, footprint, and energy. Then plug both sets of numbers into the calculator. A simple dashboard for internal review might show:
- Annual labour savings
- Annual throughput or OEE benefit
- Annual footprint and energy savings
- Payback in months
- Cumulative benefit over three to five years
Alongside the hard numbers, keep a short note on less tangible wins, such as safer ergonomics, simpler maintenance access, or flexibility to add SKUs later without a full redesign.
Real-World GTA Example, Seasonal Line Optimized for ROI
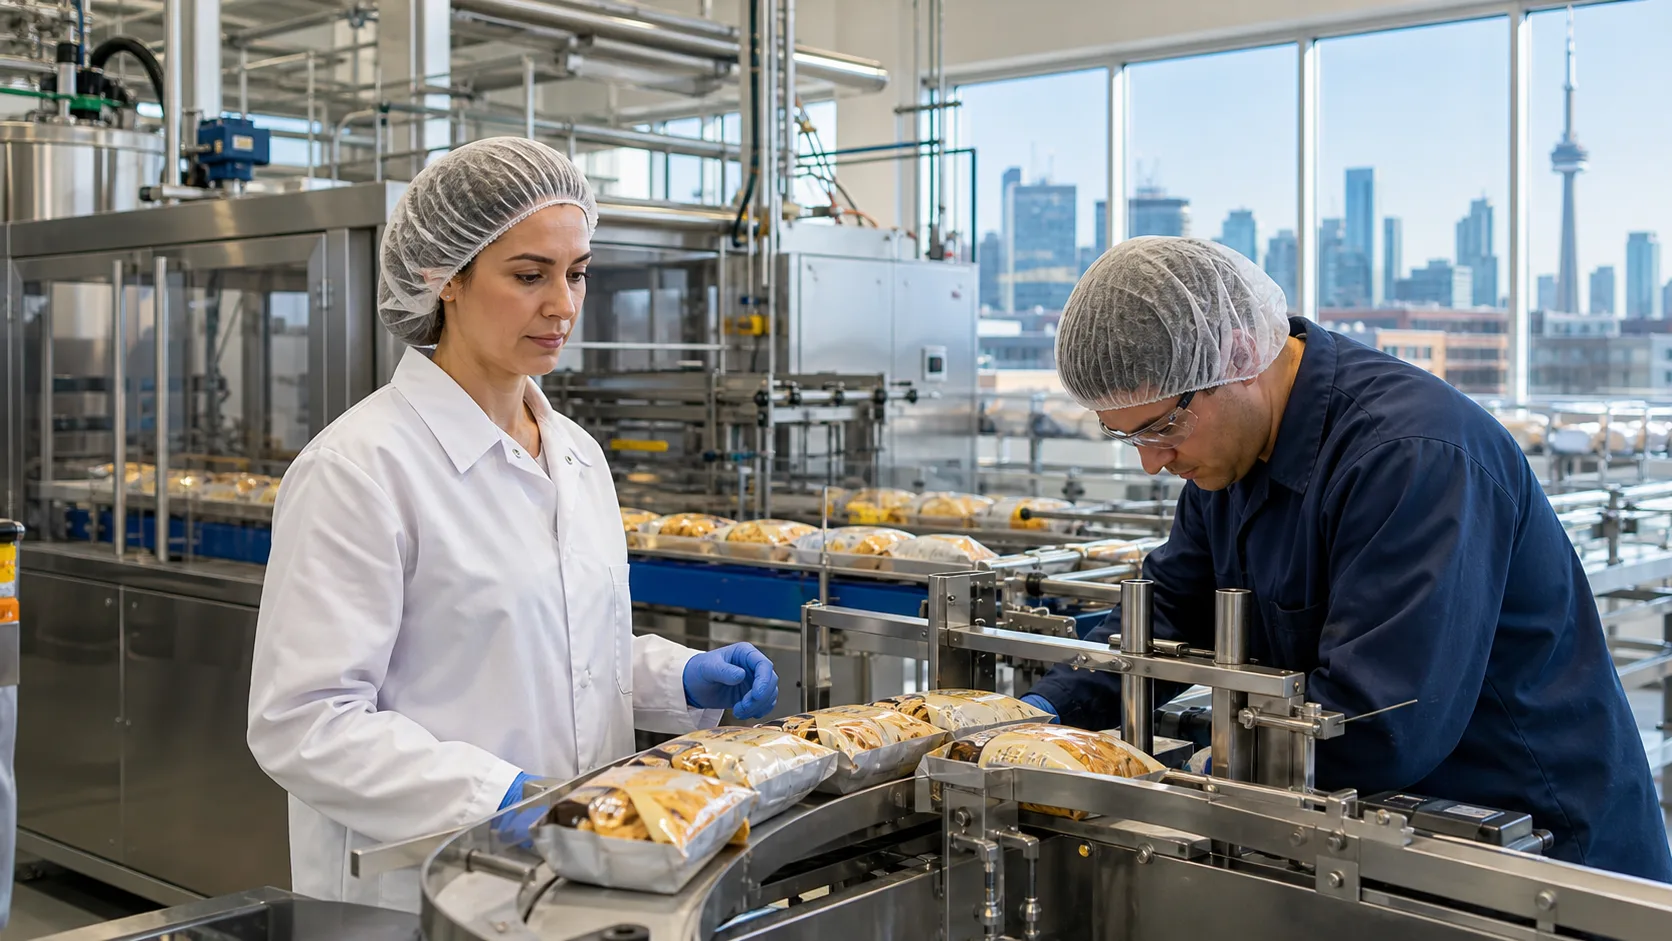
Think of a Toronto-area food or consumer goods plant that needs to handle strong summer and back-to-school demand. The packaging line is often the pinch point. You might see congestion around palletizing, stacked pallets sitting in aisles, and operators walking long distances between case packers, printers, and stretch wrappers. Energy use stays high because conveyors run even during short stoppages.
In a case like this, layout changes with end-of-line automation and custom machinery can focus on:
- Smoother conveyor flow from case packer to palletizer
- Automated palletizing to remove manual lifting
- Tighter, safer footprint around the shipping dock
- Controls that allow sections of the line to idle when blocked
When the plant measures before and after, the numbers often show fewer operators tied up on heavy manual work, improved OEE with less blocking and starving, more open floor space near the dock, and lower power draw at low-load times. The combined effect can allow the plant to handle seasonal spikes without adding extra shifts or searching for more rented space.
This kind of project is not just about new equipment. It is about designing a layout that works for the exact products, staffing, and power limits of the site, then proving the value through clear ROI math.
Turn Your Toronto Line Data Into a Clear Business Case
When you look at your packaging line data through these four levers, you give your plant, engineering, and finance teams a shared language. Instead of arguing over gut feel, you can point to labour hours, OEE impact, footprint use, and energy draw. The ROI calculator and before and after framework make it easier to compare options, from smaller layout tweaks to larger end-of-line automation projects.
At PMC Ltd., we focus on end-of-line packaging automation, custom machinery, material handling, and metal fabrication for industrial facilities across the Greater Toronto Area. When we design, supply, and install a new layout, we want our clients to see not only how the line will look, but also how it should perform over time, in dollars and cents. With the right data and a clear structure, your next layout change can be a confident, measurable step toward a more efficient plant.
Get Started With Your Project Today
If you are ready to streamline your operations and reduce costly bottlenecks, we can help you plan a practical path forward. Learn how our packaging line plant layout and design in Toronto service can support your goals with a layout tailored to your facility and production targets. At PMC LTD., we work closely with your team to align equipment, workflow, and safety requirements from day one. Have questions about your next step or timeline, just contact us to discuss your project.